

AI-enabled sensory lab software
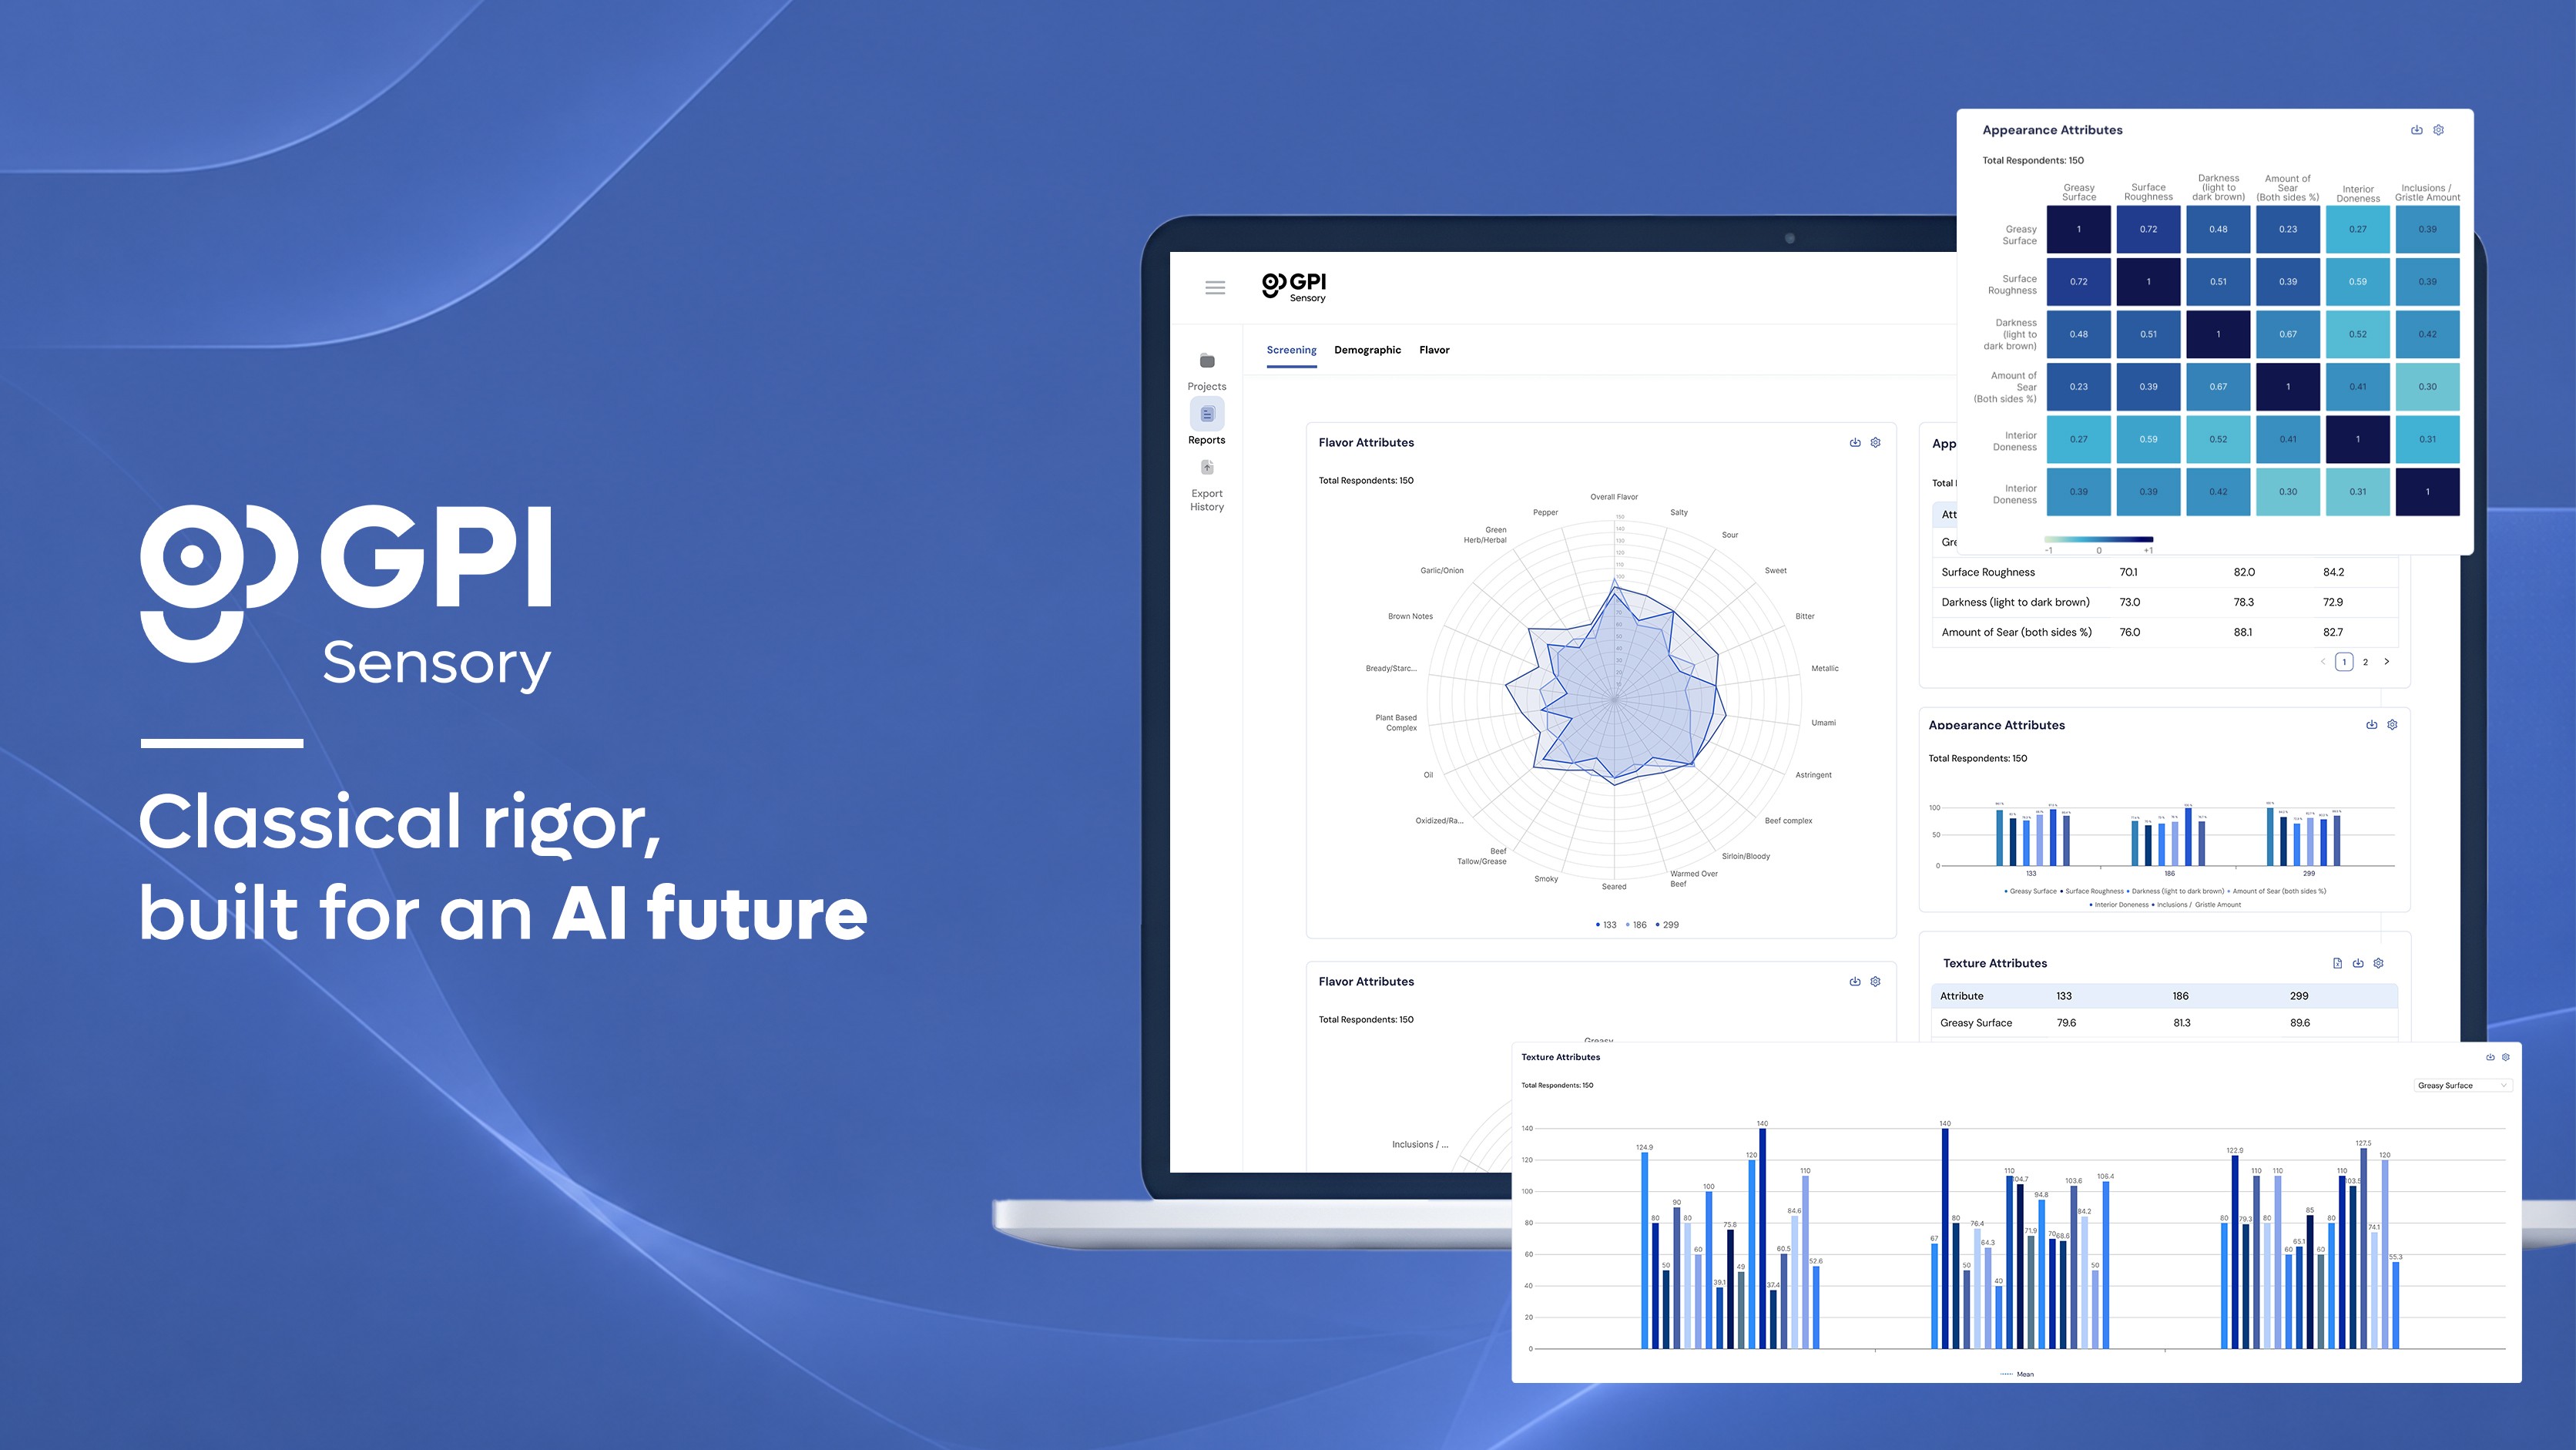
Classical rigor,
built for an AI future
One platform for any study, at any organization size, panel recruitment, questionnaire scripting, product preparation and dispatch, sessions in the lab, the office, at home or in market, online or offline, with significance-tested results and AI-enabled analysis the moment the data lands.
Request Demo
Migration Assessment

Desktop

Mobile

Tablet

Real-time
Sensory & Product Teams Using GPI
Complete Sensory Methods


Descriptive Methods
Quantify and compare sensory attributes with descriptive evaluation methods.


Preference Methods
Measure liking, acceptance, and sensory perception of products.

Discrimination Methods
Determine differences between products using established discrimination methods.


Ranking & Similarity Methods
Compare products by preference, intensity, and perceived similarity.


Temporal Methods
Measure changes in sensory perception and product liking throughout consumption.


AI Analytics
AI-enabled analysis, insights, and automated reporting.
See every method in action, guided by a sensory scientist.
Request a demo
Research with confidence
AI-enabled sensory lab software.

Language & Global Scale
Manage multilingual sensory studies across global markets.

Flexible Pricing
Scalable pricing plans that grow with your team and research needs.

24-Hour Global Support
Onboarding, regularly scheduled training, and technical support wherever your teams are.
Request a migration assessment
Full Range of Question Types
Organized by research context, from everyday preference questions to trained-panel sensory evaluation, so analysts can find what they need for any study.
Scaling & Rating
Line Scale
Category Intensity
Category Liking
Category JAR (Just About Right)
Hedonic & Acceptance Testing
Individual Balloting
Matrix
Check-All-That-Apply (CATA)
Discrimination
Triangle
Tetrad
Duo-Trio
A-Not-A
Same / Different
Difference from Control (DFC)
Preference & Ranking
Paired Preference
Paired Directional (2-AFC / 3-AFC)
Rank All
Rank N
Sorting & Mapping
Free Sort
Sort All
Sort N
Projective Mapping/Napping
Temporal
Time Intensity (TI)
TDS
TCATA
DATI
Temporal Liking
Open, Media & Others
Choose Only One
Comment
Photo & Video Upload

Smart Study Logic
Build questionnaires that adapt to every respondent.

Piping
Inserts an earlier answer into a later question, open text, choice, scales, Triangle/Tetrad, with a required fallback; piped values show in bold.


Carry-Forward
Builds options from a respondent's earlier picks, selected or unselected, auto-synced to the source.

Skip Logic / Branching
Jump, disqualify or end on any answer, with AND/OR grouping and an ELSE fallback; conflicts flagged before publishing.

Preview & Publishing
Desktop/mobile preview, full tester simulation with blinding codes, and a language switcher.
See it built for your studies
See the full workflow, or explore the docs yourself.
Request a demo
Knowledge base
Question Enhancements
Numeric
Open numeric entry for precise quantification
Constant Sum
Distribute a fixed number of points across attributes or products.
Emotion Profiling
Overlay emotional response terms onto any product evaluation.
LMS Scale
A non-linear intensity scale with verbal anchors spaced to reflect perceived magnitude.
Product, Panel & Laboratory Management
Manage your lab, panelists, and product inventory from a single, unified workspace.
Request a demo
Migration assessment

Dashboard & Scheduling
Live monitoring, real-time progress view, tracking respondents station by station
Session scheduling, book time slots, booths and product allocations with automated respondent reminders
Booth management, assign and monitor individual tasting booths, including status, product loadout and respondent check-in
Block preview and position distribution, confirm sequences and statistical balance before launch

Product Design & Packing Slips
Custom / fully balanced product order, first, last, randomized middle, or a fully custom sequence
Display blinding, respondents see a 3-digit code, never the product name
Force Delay, a configurable on-screen timer holds respondents until it elapses
QR-coded packing slips with auto-email delivery per respondent-product combination

Panel Management
Four access modes: Anonymous Codes, Panelist Codes, Email Only, or Code + Email
One record per respondent, bulk import profile, contact and status via CSV; search, filter and maintain from a centralized workspace
Org-wide code format, prefix, separator and numbering set once, applied everywhere
Send, track and resend study invitations by panel segment with no-show tracking
Product Library & Panel Reports
Centralized repository of reference samples, batch records and specifications reused across studies, with product preparation task lists and timing instructions for lab staff, and trending of a product's results against pass/fail targets over time. Panel dashboards show participation rate, max vs. tasted products, and performance charts filterable by date range or participation rate, exported as PDF.
CSV
Bulk Import
QR
Auto Packing Slips
Request a migration assessment
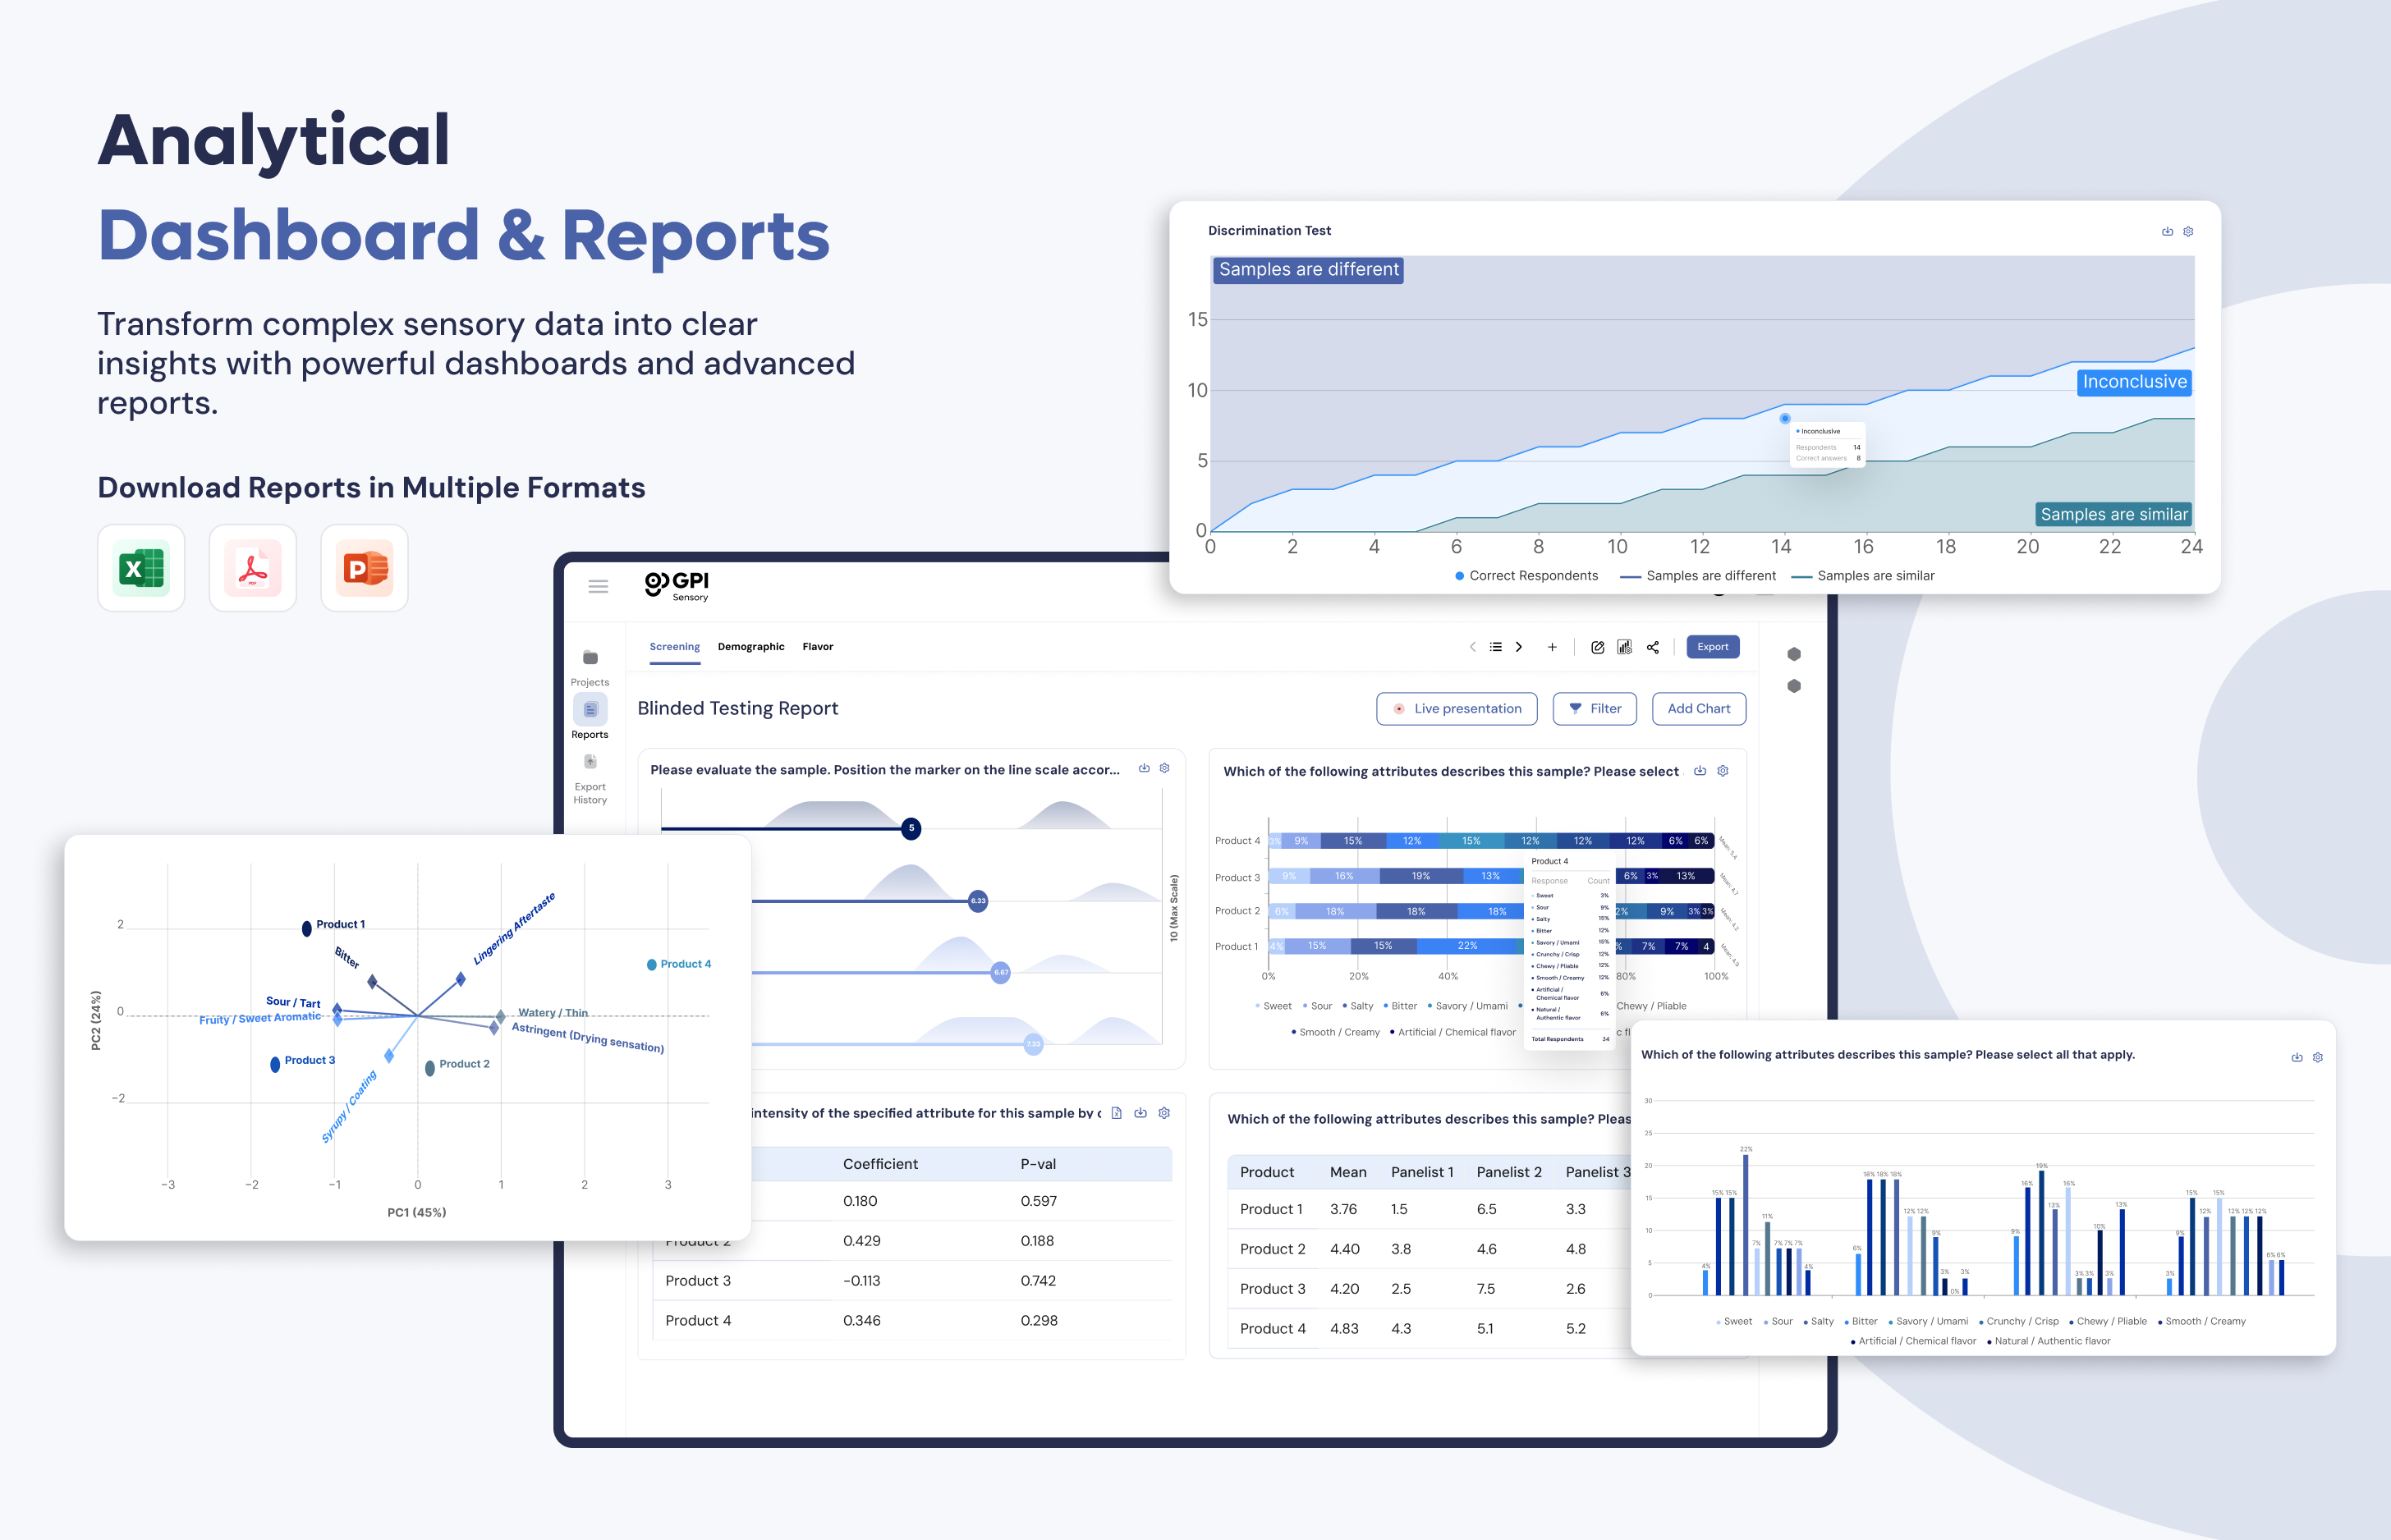
Statistics Built In. No SPSS Required.
Perform advanced statistics based on a variety of models or customize statistics to meet your organization's needs.
Live while you collect
Reports update themselves

Live reports in Dashboard or PowerPoint
Present live dashboards online or directly in PowerPoint with real time data updates.
Request a demo →
Report Structure
Build the report your way

Add any chart or aggregation
To any page from one Add Element dialog.

Drag to reorder
Rearrange, restyle and edit charts in bulk without recreating cards.

Named attribute tabs
View Texture, Color, Taste tabs plus an All Charts view.

Switch chart type per question
Choose from multiple chart types without recreating your chart.

Apply to Similar Charts
Apply a style across every chart of that type.

Range of color schemes plus custom palette
Create reports using your branding.
Export & API
Then send it anywhere
Export to PDF
Export reports and dashboards as professionally formatted PDF.
XLS
Export to Excel
Export raw data, statistical summaries, and response data to Excel.
PPT
Export to PowerPoint
Export reports and dashboards as editable PowerPoint presentations.

Complete Excel & CSV Exports
Raw data, individual responses and statistical summaries. A variety of export formats are available.

API
API connections stream study data directly into your data lake or warehouse.

Enterprise Integrations
Custom APIs, exports and statistics for enterprise-scale pipelines
In-Dashboard Statistics
Full range of tests, organized by framework
Perform advanced statistics based on a variety of models or customize statistics to meet your organization's needs. All run on live data, no export step.
Basic Statistics
4 tests
Mean and Group
Mean and Group (Cross-Tab)
Top Box / Bottom Box
Chi-Square

Hypothesis Testing
12 tests
ANOVA
Repeated Measures ANOVA
Paired t-test
Independent Samples t-test
Kruskal-Wallis
Friedman
Mann-Whitney U
Fisher's Exact
Z-test for Proportions
Cochran's Q
Advanced Proportion Test
Marascuilo + Bonferroni
Post Hoc
4 tests
Tukey HSD
Fisher's LSD
Duncan's
Dunnett's
Multivariate
9 tests
PCA
Factor Analysis
Correspondence Analysis
Multiple Correspondence Analysis (MCA)
Multiple Factor Analysis (MFA)
Conjoint Analysis
MaxDiff
D-Prime (Triangle, Tetrad, IBT)
Pearson & Spearman Correlation
Advanced Analytics
4 tests
Penalty Table & Chart
Cross-tab segmentation
Filter by demographic / screener / quota
Live monitoring dashboards
Open-Ended Analytics
4 tests
Verbatim Coding
Word Cloud & Frequency
Sentiment Scoring
Theme Clustering
Intelligence Built Into Every Result
Analysis, themes, narrative reporting and forecasting, generated from the study data you already collected.

Automated Analysis & Recommendations
AI-enabled analysis of study results, providing key findings and suggested next steps.

Theme Detection & Summaries
Automatically clusters open-ended responses into themes with plain-language summaries.


AI-Assisted Reporting
Generate a narrative report directly from study data, then refine it conversationally before export.


Prediction Models
Intelligent forecasting and predictive analytics that estimate future outcomes by using historical research data.
See these AI capabilities applied to your own study data.
Request a demo
Global Capabilities & Advanced Features
Build a study in Zurich, translate it for a panel in São Paulo, and report on it in Singapore — all from the same platform. Work can be shared or kept separate across locations, and analysts view the platform in their preferred language.
Request a demo
Migration assessment
Cross Organization Collaboration
Fully Secure
Enterprise-grade security with role-based access control, data isolation, and audit logging.
SSO
Authenticate using enterprise identity providers such as Microsoft Entra ID (Azure AD), Okta, and other SAML or OpenID Connect providers.
Respondent & UI languages
Deliver studies in multiple languages and tailored interface settings.
Templates manage workflows
Maintain a consistent setup across locations.
Security, Access & Integration
Multi-organization architecture
Each organization’s users, panels and data are stored separately.
Access Control List (ACL)
Manage application and study access with configurable Owner, Editor, and Viewer roles, supported by audit logs.
Enterprise standalone organizations
Give clients access through their own Administrator accounts.
Integrate other lab tools
LIMS connectivity for sample tracking and lab results, feeding directly into GPI studies.
Build Your Sensory Lab In GPI

Sensory Lab
A clean respondent interface, with display blinding and enforced product order, puts panelists at ease so they concentrate on testing.

Multiple Lab Testing
Set up a study centrally and collect data at different locations, with balanced product rotation, blinding codes, and Force Delay timers enforcing the protocol on-site.

Migration Support
And if you are moving from another system or bringing historical data with you, we support the whole transition, rebuilding your existing studies and templates, formatting and uploading your data, and connecting your LIMS and other sources, so your team moves across without ever missing a beat.
Request a demo
Migration assessment
Scales with your team and needs
Build a study in Zurich, translate it for a panel in São Paulo, and report on it in Singapore — all from the same platform. Work can be shared or kept separate across locations, and analysts view the platform in their preferred language.
Starter
For individuals and teams running targeted, ad hoc product experience research, a single claim test, a reformulation check, one market.
What you get:

Priced per project, no commitment

Classic sensory tests, templated for fast set-up and execution

Standard platform outputs and reporting
Single-language operation and testing
Technical support by email
AI features on all plans
Contact Sales
Growth
For innovation, insights and R&D teams whose investment decisions need repeatable, comparable evidence across projects, markets and time.
All the features in Starter Plus:
Annual subscription priced on usage; activate only the methods you need
Full multi-method study workflows; build and save your own projects and templates
Longitudinal tracking and cross-market comparison across your full project history
Multi-language operation and testing with live translation
Chat and email support from GPI's sensory and data science experts
24-hour global technical support
Scheduled online training programs, plus bespoke sessions on request
Structured onboarding and data migration from your old system
AI features on all plans
Contact Sales
Enterprise
For high-volume, cross-functional organizations running continuous product experience research across markets, panels, categories and lifecycle stages.
All the features in Growth Plus:

Enterprise agreement covering all teams and seats

Multi-team workspaces with study governance: approval workflows, protocol libraries, audit trail

Organization-wide data layer; benchmark across teams, categories and business units
Centralized management of multiple panels across markets
Sensory and data science experts, available on demand
Dedicated success manager, SLA-backed
SSO, custom branding, custom feature and algorithm development on request
AI features on all plans
Contact Sales
AI-enabled sensory lab software
Classical rigor,
built for an AI future
One platform for any study, at any organization size, panel recruitment, questionnaire scripting, product preparation and dispatch, sessions in the lab, the office, at home or in market, online or offline, with significance-tested results and AI-enabled analysis the moment the data lands.
Request a demo
Migration assessment

Desktop
Mobile
Tablet
Real-time
Sensory & Product Teams Using GPI
Methods
Complete Sensory Methods
Descriptive Methods
Quantify and compare sensory attributes with descriptive evaluation methods.
Preference Methods
Measure liking, acceptance, and sensory perception of products.
Discrimination Methods
Determine differences between products using established discrimination methods.
Ranking & Similarity
Methods
Compare products by preference, intensity, and perceived similarity.
Temporal Methods
Measure changes in sensory perception and product liking throughout consumption.
AI Analytics
AI-enabled analysis, insights, and automated reporting.
See every method in action, guided by a sensory scientist.
Request a demo
Why GPI
Research with confidence
AI-enabled sensory lab software.
Language & Global Scale
Manage multilingual sensory studies across global markets.
Flexible Pricing
Scalable pricing plans that grow with your team and research needs.
24-Hour Global Support
Onboarding, regularly scheduled training, and technical support wherever your teams are.
Request a migration assessment
Full Range of Question Types
Organized by research context, from everyday preference questions to trained-panel sensory evaluation, so analysts can find what they need for any study.
Scaling & Rating
Line Scale
Category Intensity
Category Liking
Category JAR (Just About Right)
Hedonic & Acceptance Testing
Individual Balloting
Matrix
Check-All-That-Apply (CATA)
Discrimination
Triangle
Tetrad
Duo-Trio
A-Not-A
Same / Different
Difference from Control (DFC)
Preference & Ranking
Paired Preference
Paired Directional (2-AFC / 3-AFC)
Rank All
Rank N
Sorting & Mapping
Free Sort
Sort All
Sort N
Projective Mapping/Napping
Temporal
Time Intensity (TI)
TDS
TCATA
DATI
Temporal Liking
Open, Media & Others
Choose Only One
Comment
Photo & Video Upload
Smart Study Logic
Build questionnaires that adapt to every respondent.
Piping
Inserts an earlier answer into a later question, open text, choice, scales, Triangle/Tetrad, with a required fallback; piped values show in bold.
Carry-Forward
Builds options from a respondent's earlier picks, selected or unselected, auto-synced to the source.
Skip Logic / Branching
Jump, disqualify or end on any answer, with AND/OR grouping and an ELSE fallback; conflicts flagged before publishing.
Preview & Publishing
Desktop/mobile preview, full tester simulation with blinding codes, and a language switcher.
See it built for your studies
See the full workflow, or explore the docs yourself.
Request a demo
Knowledge base
Question Enhancements
Numeric
Open numeric entry for precise quantification
Constant Sum
Distribute a fixed number of points across attributes or products.
Emotion Profiling
Overlay emotional response terms onto any product evaluation.
LMS Scale
A non-linear intensity scale with verbal anchors spaced to reflect perceived magnitude.
Lab & Panel
Product, Panel & Laboratory Management
Manage your lab, panelists, and product inventory from a single, unified workspace.
Request a demo
Migration assessment

Dashboard & Scheduling
Live monitoring, real-time progress view, tracking respondents station by station
Session scheduling, book time slots, booths and product allocations with automated respondent reminders
Booth management, assign and monitor individual tasting booths, including status, product loadout and respondent check-in
Block preview and position distribution, confirm sequences and statistical balance before launch
Product Design & Packing Slips
Custom / fully balanced product order, first, last, randomized middle, or a fully custom sequence
Display blinding, respondents see a 3-digit code, never the product name
Force Delay, a configurable on-screen timer holds respondents until it elapses
QR-coded packing slips with auto-email delivery per respondent-product combination
Panel Management
Four access modes: Anonymous Codes, Panelist Codes, Email Only, or Code + Email
One record per respondent, bulk import profile, contact and status via CSV; search, filter and maintain from a centralized workspace
Org-wide code format, prefix, separator and numbering set once, applied everywhere
Send, track and resend study invitations by panel segment with no-show tracking
Product Library & Panel Reports
Centralized repository of reference samples, batch records and specifications reused across studies, with product preparation task lists and timing instructions for lab staff, and trending of a product's results against pass/fail targets over time. Panel dashboards show participation rate, max vs. tasted products, and performance charts filterable by date range or participation rate, exported as PDF.
CSV
Bulk Import
QR
Auto Packing Slips
Request a migration assessment
Statistics Built In. No SPSS Required.
Perform advanced statistics based on a variety of models or customize statistics to meet your organization's needs.
Live while you collect
Reports update themselves

Live reports in Dashboard or PowerPoint
Present live dashboards online or directly in PowerPoint with real time data updates.
Request a demo →
Report Structure
Build the report your way
Add any chart or aggregation
To any page from one Add Element dialog.
Drag to reorder
Rearrange, restyle and edit charts in bulk without recreating cards.
Named attribute tabs
View Texture, Color, Taste tabs plus an All Charts view.
Switch chart type per question
Choose from multiple chart types without recreating your chart.
Apply to Similar Charts
Apply a style across every chart of that type.
Range of color schemes plus custom palette
Create reports using your branding.
Export & API
Then send it anywhere
Export to PDF
Export reports and dashboards as professionally formatted PDF.
XLS
Export to Excel
Export raw data, statistical summaries, and response data to Excel.
PPT
Export to PowerPoint
Export reports and dashboards as editable PowerPoint presentations.
Complete Excel & CSV Exports
Raw data, individual responses and statistical summaries. A variety of export formats are available.
API
API connections stream study data directly into your data lake or warehouse.
Enterprise Integrations
Custom APIs, exports and statistics for enterprise-scale pipelines
In-Dashboard Statistics
Full range of tests, organized by framework
Perform advanced statistics based on a variety of models or customize statistics to meet your organization's needs. All run on live data, no export step.
Basic Statistics
4 tests
Mean and Group
Mean and Group (Cross-Tab)
Top Box / Bottom Box
Chi-Square

Hypothesis Testing
12 tests
ANOVA
Repeated Measures ANOVA
Paired t-test
Independent Samples t-test
Kruskal-Wallis
Friedman
Mann-Whitney U
Fisher's Exact
Z-test for Proportions
Cochran's Q
Advanced Proportion Test
Marascuilo + Bonferroni
Post Hoc
4 tests
Tukey HSD
Fisher's LSD
Duncan's
Dunnett's
Multivariate
9 tests
PCA
Factor Analysis
Correspondence Analysis
Multiple Correspondence Analysis (MCA)
Multiple Factor Analysis (MFA)
Conjoint Analysis
MaxDiff
D-Prime (Triangle, Tetrad, IBT)
Pearson & Spearman Correlation

Advanced Analytics
4 tests
Penalty Table & Chart
Cross-tab segmentation
Filter by demographic / screener / quota
Live monitoring dashboards
Open-Ended Analytics
4 tests
Verbatim Coding
Word Cloud & Frequency
Sentiment Scoring
Theme Clustering
Intelligence Built Into Every Result
Analysis, themes, narrative reporting and forecasting, generated from the study data you already collected.
Automated Analysis & Recommendations
AI-enabled analysis of study results, providing key findings and suggested next steps.
Theme Detection & Summaries
Automatically clusters open-ended responses into themes with plain-language summaries.
AI-Assisted Reporting
Generate a narrative report directly from study data, then refine it conversationally before export.
Prediction Models
Intelligent forecasting and predictive analytics that estimate future outcomes by using historical research data.
See these AI capabilities applied to your own study data.
Request a demo
Global Capabilities & Advanced Features
Build a study in Zurich, translate it for a panel in São Paulo, and report on it in Singapore — all from the same platform. Work can be shared or kept separate across locations, and analysts view the platform in their preferred language.
Request a demo
Migration assessment
Cross Organization Collaboration
Fully Secure
Enterprise-grade security with role-based access control, data isolation, and audit logging.
SSO
Authenticate using enterprise identity providers such as Microsoft Entra ID (Azure AD), Okta, and other SAML or OpenID Connect providers.
Respondent & UI languages
Deliver studies in multiple languages and tailored interface settings.
Templates manage workflows
Maintain a consistent setup across locations.
Security, Access & Integration
Multi-organization architecture
Each organization’s users, panels and data are stored separately.
Access Control List (ACL)
Manage application and study access with configurable Owner, Editor, and Viewer roles, supported by audit logs.
Enterprise standalone organizations
Give clients access through their own Administrator accounts.
Integrate other lab tools
LIMS connectivity for sample tracking and lab results, feeding directly into GPI studies.
Build Your Sensory Lab In GPI
Sensory Lab
A clean respondent interface, with display blinding and enforced product order, puts panelists at ease so they concentrate on testing.
Multiple Lab Testing
Set up a study centrally and collect data at different locations, with balanced product rotation, blinding codes, and Force Delay timers enforcing the protocol on-site.
Migration Support
And if you are moving from another system or bringing historical data with you, we support the whole transition, rebuilding your existing studies and templates, formatting and uploading your data, and connecting your LIMS and other sources, so your team moves across without ever missing a beat.
Request a demo
Migration assessment
Scales with your team and needs
Build a study in Zurich, translate it for a panel in São Paulo, and report on it in Singapore — all from the same platform. Work can be shared or kept separate across locations, and analysts view the platform in their preferred language.
Starter
For individuals and teams running targeted, ad hoc product experience research, a single claim test, a reformulation check, one market.
What you get:
Priced per project, no commitment
Classic sensory tests, templated for fast set-up and execution
Standard platform outputs and reporting
Single-language operation and testing
Technical support by email
AI features on all plans
Contact Sales
Growth
For innovation, insights and R&D teams whose investment decisions need repeatable, comparable evidence across projects, markets and time.
All the features in Starter Plus:
Annual subscription priced on usage; activate only the methods you need
Full multi-method study workflows; build and save your own projects and templates
Longitudinal tracking and cross-market comparison across your full project history
Multi-language operation and testing with live translation
Chat and email support from GPI's sensory and data science experts
24-hour global technical support
Scheduled online training programs, plus bespoke sessions on request
Structured onboarding and data migration from your old system
AI features on all plans
Contact Sales
Enterprise
For high-volume, cross-functional organizations running continuous product experience research across markets, panels, categories and lifecycle stages.
All the features in Growth Plus:
Enterprise agreement covering all teams and seats
Multi-team workspaces with study governance: approval workflows, protocol libraries, audit trail
Organization-wide data layer; benchmark across teams, categories and business units
Centralized management of multiple panels across markets
Sensory and data science experts, available on demand
Dedicated success manager, SLA-backed
SSO, custom branding, custom feature and algorithm development on request
AI features on all plans
Contact Sales
Request Demo
AI-enabled sensory lab software
Classical rigor,
built for an AI future
One platform for any study, at any organization size, panel recruitment, questionnaire scripting, product preparation and dispatch, sessions in the lab, the office, at home or in market, online or offline, with significance-tested results and AI-enabled analysis the moment the data lands.
Request a demo
Migration assessment

Desktop
Mobile
Tablet
Real-time
Sensory & Product Teams Using GPI
Methods
Complete Sensory Methods
Descriptive Methods
Quantify and compare sensory attributes with descriptive evaluation methods.
Preference Methods
Measure liking, acceptance, and sensory perception of products.
Discrimination Methods
Determine differences between products using established discrimination methods.
Ranking & Similarity
Methods
Compare products by preference, intensity, and perceived similarity.
Temporal Methods
Measure changes in sensory perception and product liking throughout consumption.
AI Analytics
AI-enabled analysis, insights, and automated reporting.
See every method in action, guided by a sensory scientist.
Request a demo
Why GPI
Research with confidence
AI-enabled sensory lab software.
Language & Global Scale
Manage multilingual sensory studies across global markets.
Flexible Pricing
Scalable pricing plans that grow with your team and research needs.
24-Hour Global Support
Onboarding, regularly scheduled training, and technical support wherever your teams are.
Request a migration assessment
Full Range of Question Types
Organized by research context, from everyday preference questions to trained-panel sensory evaluation, so analysts can find what they need for any study.
Scaling & Rating
Line Scale
Category Intensity
Category Liking
Category JAR (Just About Right)
Hedonic & Acceptance Testing
Individual Balloting
Matrix
Check-All-That-Apply (CATA)
Discrimination
Triangle
Tetrad
Duo-Trio
A-Not-A
Same / Different
Difference from Control (DFC)
Preference & Ranking
Paired Preference
Paired Directional (2-AFC / 3-AFC)
Rank All
Rank N
Sorting & Mapping
Free Sort
Sort All
Sort N
Projective Mapping/Napping
Temporal
Time Intensity (TI)
TDS
TCATA
DATI
Temporal Liking
Open, Media & Others
Choose Only One
Comment
Photo & Video Upload
Smart Study Logic
Build questionnaires that adapt to every respondent.
Piping
Inserts an earlier answer into a later question, open text, choice, scales, Triangle/Tetrad, with a required fallback; piped values show in bold.
Carry-Forward
Builds options from a respondent's earlier picks, selected or unselected, auto-synced to the source.
Skip Logic / Branching
Jump, disqualify or end on any answer, with AND/OR grouping and an ELSE fallback; conflicts flagged before publishing.
Preview & Publishing
Desktop/mobile preview, full tester simulation with blinding codes, and a language switcher.
See it built for your studies
See the full workflow, or explore the docs yourself.
Request a demo
Knowledge base
Question Enhancements
Numeric
Open numeric entry for precise quantification
Constant Sum
Distribute a fixed number of points across attributes or products.
Emotion Profiling
Overlay emotional response terms onto any product evaluation.
LMS Scale
A non-linear intensity scale with verbal anchors spaced to reflect perceived magnitude.
Lab & Panel
Product, Panel & Laboratory Management
Manage your lab, panelists, and product inventory from a single, unified workspace.
Request a demo
Migration assessment
Dashboard & Scheduling
Live monitoring, real-time progress view, tracking respondents station by station
Session scheduling, book time slots, booths and product allocations with automated respondent reminders
Booth management, assign and monitor individual tasting booths, including status, product loadout and respondent check-in
Block preview and position distribution, confirm sequences and statistical balance before launch
Product Design & Packing Slips
Custom / fully balanced product order, first, last, randomized middle, or a fully custom sequence
Display blinding, respondents see a 3-digit code, never the product name
Force Delay, a configurable on-screen timer holds respondents until it elapses
QR-coded packing slips with auto-email delivery per respondent-product combination
Panel Management
Four access modes: Anonymous Codes, Panelist Codes, Email Only, or Code + Email
One record per respondent, bulk import profile, contact and status via CSV; search, filter and maintain from a centralized workspace
Org-wide code format, prefix, separator and numbering set once, applied everywhere
Send, track and resend study invitations by panel segment with no-show tracking
Product Library & Panel Reports
Centralized repository of reference samples, batch records and specifications reused across studies, with product preparation task lists and timing instructions for lab staff, and trending of a product's results against pass/fail targets over time. Panel dashboards show participation rate, max vs. tasted products, and performance charts filterable by date range or participation rate, exported as PDF.
CSV
Bulk Import
QR
Auto Packing Slips
Request a migration assessment
Statistics Built In. No SPSS Required.
Perform advanced statistics based on a variety of models or customize statistics to meet your organization's needs.
Live while you collect
Reports update themselves

Live reports in Dashboard or PowerPoint
Present live dashboards online or directly in PowerPoint with real time data updates.
Request a demo →
Report Structure
Build the report your way
Add any chart or aggregation
To any page from one Add Element dialog.
Drag to reorder
Rearrange, restyle and edit charts in bulk without recreating cards.
Named attribute tabs
View Texture, Color, Taste tabs plus an All Charts view.
Switch chart type per question
Choose from multiple chart types without recreating your chart.
Apply to Similar Charts
Apply a style across every chart of that type.
Range of color schemes plus custom palette
Create reports using your branding.
Export & API
Then send it anywhere
Export to PDF
Export reports and dashboards as professionally formatted PDF.
XLS
Export to Excel
Export raw data, statistical summaries, and response data to Excel.
PPT
Export to PowerPoint
Export reports and dashboards as editable PowerPoint presentations.
Complete Excel & CSV Exports
Raw data, individual responses and statistical summaries. A variety of export formats are available.
API
API connections stream study data directly into your data lake or warehouse.
Enterprise Integrations
Custom APIs, exports and statistics for enterprise-scale pipelines
In-Dashboard Statistics
Full range of tests, organized by framework
Perform advanced statistics based on a variety of models or customize statistics to meet your organization's needs. All run on live data, no export step.
Basic Statistics
4 tests
Mean and Group
Mean and Group (Cross-Tab)
Top Box / Bottom Box
Chi-Square
Hypothesis Testing
12 tests
ANOVA
Repeated Measures ANOVA
Paired t-test
Independent Samples t-test
Kruskal-Wallis
Friedman
Mann-Whitney U
Fisher's Exact
Z-test for Proportions
Cochran's Q
Advanced Proportion Test
Marascuilo + Bonferroni
Post Hoc
4 tests
Tukey HSD
Fisher's LSD
Duncan's
Dunnett's
Multivariate
9 tests
PCA
Factor Analysis
Correspondence Analysis
Multiple Correspondence Analysis (MCA)
Multiple Factor Analysis (MFA)
Conjoint Analysis
MaxDiff
D-Prime (Triangle, Tetrad, IBT)
Pearson & Spearman Correlation
Advanced Analytics
4 tests
Penalty Table & Chart
Cross-tab segmentation
Filter by demographic / screener / quota
Live monitoring dashboards
Open-Ended Analytics
4 tests
Verbatim Coding
Word Cloud & Frequency
Sentiment Scoring
Theme Clustering
Intelligence Built Into Every Result
Analysis, themes, narrative reporting and forecasting, generated from the study data you already collected.
Automated Analysis & Recommendations
AI-enabled analysis of study results, providing key findings and suggested next steps.
Theme Detection & Summaries
Automatically clusters open-ended responses into themes with plain-language summaries.
AI-Assisted Reporting
Generate a narrative report directly from study data, then refine it conversationally before export.
Prediction Models
Intelligent forecasting and predictive analytics that estimate future outcomes by using historical research data.
See these AI capabilities applied to your own study data.
Request a demo
Global Capabilities & Advanced Features
Build a study in Zurich, translate it for a panel in São Paulo, and report on it in Singapore — all from the same platform. Work can be shared or kept separate across locations, and analysts view the platform in their preferred language.
Request a demo
Migration assessment
Cross Organization Collaboration
Fully Secure
Enterprise-grade security with role-based access control, data isolation, and audit logging.
SSO
Authenticate using enterprise identity providers such as Microsoft Entra ID (Azure AD), Okta, and other SAML or OpenID Connect providers.
Respondent & UI languages
Deliver studies in multiple languages and tailored interface settings.
Templates manage workflows
Maintain a consistent setup across locations.
Security, Access & Integration
Multi-organization architecture
Each organization’s users, panels and data are stored separately.
Access Control List (ACL)
Manage application and study access with configurable Owner, Editor, and Viewer roles, supported by audit logs.
Enterprise standalone organizations
Give clients access through their own Administrator accounts.
Integrate other lab tools
LIMS connectivity for sample tracking and lab results, feeding directly into GPI studies.
Build Your Sensory Lab In GPI
Sensory Lab
A clean respondent interface, with display blinding and enforced product order, puts panelists at ease so they concentrate on testing.
Multiple Lab Testing
Set up a study centrally and collect data at different locations, with balanced product rotation, blinding codes, and Force Delay timers enforcing the protocol on-site.
Migration Support
And if you are moving from another system or bringing historical data with you, we support the whole transition, rebuilding your existing studies and templates, formatting and uploading your data, and connecting your LIMS and other sources, so your team moves across without ever missing a beat.
Request a demo
Migration assessment
Scales with your team and needs
Build a study in Zurich, translate it for a panel in São Paulo, and report on it in Singapore — all from the same platform. Work can be shared or kept separate across locations, and analysts view the platform in their preferred language.
Starter
For individuals and teams running targeted, ad hoc product experience research, a single claim test, a reformulation check, one market.
What you get:
Priced per project, no commitment
Classic sensory tests, templated for fast set-up and execution
Standard platform outputs and reporting
Single-language operation and testing
Technical support by email
AI features on all plans
Contact Sales
Growth
For innovation, insights and R&D teams whose investment decisions need repeatable, comparable evidence across projects, markets and time.
All the features in Starter Plus:
Annual subscription priced on usage; activate only the methods you need
Full multi-method study workflows; build and save your own projects and templates
Longitudinal tracking and cross-market comparison across your full project history
Multi-language operation and testing with live translation
Chat and email support from GPI's sensory and data science experts
24-hour global technical support
Scheduled online training programs, plus bespoke sessions on request
Structured onboarding and data migration from your old system
AI features on all plans
Contact Sales
Enterprise
For high-volume, cross-functional organizations running continuous product experience research across markets, panels, categories and lifecycle stages.
All the features in Growth Plus:
Enterprise agreement covering all teams and seats
Multi-team workspaces with study governance: approval workflows, protocol libraries, audit trail
Organization-wide data layer; benchmark across teams, categories and business units
Centralized management of multiple panels across markets
Sensory and data science experts, available on demand
Dedicated success manager, SLA-backed
SSO, custom branding, custom feature and algorithm development on request
AI features on all plans
Contact Sales
Request Demo
AI-enabled sensory lab software
Classical rigor,
built for an AI future
One platform for any study, at any organization size, panel recruitment, questionnaire scripting, product preparation and dispatch, sessions in the lab, the office, at home or in market, online or offline, with significance-tested results and AI-enabled analysis the moment the data lands.
Request a demo
Migration assessment

Desktop
Mobile
Tablet
Real-time
Sensory & Product Teams Using GPI
Methods
Complete Sensory Methods
Descriptive Methods
Quantify and compare sensory attributes with descriptive evaluation methods.
Preference Methods
Measure liking, acceptance, and sensory perception of products.
Discrimination Methods
Determine differences between products using established discrimination methods.
Ranking & Similarity
Methods
Compare products by preference, intensity, and perceived similarity.
Temporal Methods
Measure changes in sensory perception and product liking throughout consumption.
AI Analytics
AI-enabled analysis, insights, and automated reporting.
See every method in action, guided by a sensory scientist.
Request a demo
Why GPI
Research with confidence
AI-enabled sensory lab software.
Language & Global Scale
Manage multilingual sensory studies across global markets.
Flexible Pricing
Scalable pricing plans that grow with your team and research needs.
24-Hour Global Support
Onboarding, regularly scheduled training, and technical support wherever your teams are.
Request a migration assessment
Full Range of Question Types
Organized by research context, from everyday preference questions to trained-panel sensory evaluation, so analysts can find what they need for any study.
Scaling & Rating
Line Scale
Category Intensity
Category Liking
Category JAR (Just About Right)
Hedonic & Acceptance Testing
Individual Balloting
Matrix
Check-All-That-Apply (CATA)
Discrimination
Triangle
Tetrad
Duo-Trio
A-Not-A
Same / Different
Difference from Control (DFC)
Preference & Ranking
Paired Preference
Paired Directional (2-AFC / 3-AFC)
Rank All
Rank N
Sorting & Mapping
Free Sort
Sort All
Sort N
Projective Mapping/Napping
Temporal
Time Intensity (TI)
TDS
TCATA
DATI
Temporal Liking
Open, Media & Others
Choose Only One
Comment
Photo & Video Upload
Smart Study Logic
Build questionnaires that adapt to every respondent.
Piping
Inserts an earlier answer into a later question, open text, choice, scales, Triangle/Tetrad, with a required fallback; piped values show in bold.
Carry-Forward
Builds options from a respondent's earlier picks, selected or unselected, auto-synced to the source.
Skip Logic / Branching
Jump, disqualify or end on any answer, with AND/OR grouping and an ELSE fallback; conflicts flagged before publishing.
Preview & Publishing
Desktop/mobile preview, full tester simulation with blinding codes, and a language switcher.
See it built for your studies
See the full workflow, or explore the docs yourself.
Request a demo
Knowledge base
Question Enhancements
Numeric
Open numeric entry for precise quantification
Constant Sum
Distribute a fixed number of points across attributes or products.
Emotion Profiling
Overlay emotional response terms onto any product evaluation.
LMS Scale
A non-linear intensity scale with verbal anchors spaced to reflect perceived magnitude.
Lab & Panel
Product, Panel & Laboratory Management
Manage your lab, panelists, and product inventory from a single, unified workspace.
Request a demo
Migration assessment
Dashboard & Scheduling
Live monitoring, real-time progress view, tracking respondents station by station
Session scheduling, book time slots, booths and product allocations with automated respondent reminders
Booth management, assign and monitor individual tasting booths, including status, product loadout and respondent check-in
Block preview and position distribution, confirm sequences and statistical balance before launch
Product Design & Packing Slips
Custom / fully balanced product order, first, last, randomized middle, or a fully custom sequence
Display blinding, respondents see a 3-digit code, never the product name
Force Delay, a configurable on-screen timer holds respondents until it elapses
QR-coded packing slips with auto-email delivery per respondent-product combination
Panel Management
Four access modes: Anonymous Codes, Panelist Codes, Email Only, or Code + Email
One record per respondent, bulk import profile, contact and status via CSV; search, filter and maintain from a centralized workspace
Org-wide code format, prefix, separator and numbering set once, applied everywhere
Send, track and resend study invitations by panel segment with no-show tracking
Product Library & Panel Reports
Centralized repository of reference samples, batch records and specifications reused across studies, with product preparation task lists and timing instructions for lab staff, and trending of a product's results against pass/fail targets over time. Panel dashboards show participation rate, max vs. tasted products, and performance charts filterable by date range or participation rate, exported as PDF.
CSV
Bulk Import
QR
Auto Packing Slips
Request a migration assessment
Statistics Built In. No SPSS Required.
Perform advanced statistics based on a variety of models or customize statistics to meet your organization's needs.
Live while you collect
Reports update themselves
Live reports in Dashboard or PowerPoint
Present live dashboards online or directly in PowerPoint with real time data updates.
Request a demo →
Report Structure
Build the report your way

Add any chart or aggregation
To any page from one Add Element dialog.
Drag to reorder
Rearrange, restyle and edit charts in bulk without recreating cards.

Named attribute tabs
View Texture, Color, Taste tabs plus an All Charts view.

Switch chart type per question
Choose from multiple chart types without recreating your chart.

Apply to Similar Charts
Apply a style across every chart of that type.

Range of color schemes plus custom palette
Create reports using your branding.
Export & API
Then send it anywhere
Export to PDF
Export reports and dashboards as professionally formatted PDF.
XLS
Export to Excel
Export raw data, statistical summaries, and response data to Excel.
PPT
Export to PowerPoint
Export reports and dashboards as editable PowerPoint presentations.
Complete Excel & CSV Exports
Raw data, individual responses and statistical summaries. A variety of export formats are available.

API
API connections stream study data directly into your data lake or warehouse.

Enterprise Integrations
Custom APIs, exports and statistics for enterprise-scale pipelines
In-Dashboard Statistics
Full range of tests, organized by framework
Perform advanced statistics based on a variety of models or customize statistics to meet your organization's needs. All run on live data, no export step.
Basic Statistics
4 tests
Mean and Group
Mean and Group (Cross-Tab)
Top Box / Bottom Box
Chi-Square

Hypothesis Testing
12 tests
ANOVA
Repeated Measures ANOVA
Paired t-test
Independent Samples t-test
Kruskal-Wallis
Friedman
Mann-Whitney U
Fisher's Exact
Z-test for Proportions
Cochran's Q
Advanced Proportion Test
Marascuilo + Bonferroni
Post Hoc
4 tests
Tukey HSD
Fisher's LSD
Duncan's
Dunnett's
Multivariate
9 tests
PCA
Factor Analysis
Correspondence Analysis
Multiple Correspondence Analysis (MCA)
Multiple Factor Analysis (MFA)
Conjoint Analysis
MaxDiff
D-Prime (Triangle, Tetrad, IBT)
Pearson & Spearman Correlation
Advanced Analytics
4 tests
Penalty Table & Chart
Cross-tab segmentation
Filter by demographic / screener / quota
Live monitoring dashboards
Open-Ended Analytics
4 tests
Verbatim Coding
Word Cloud & Frequency
Sentiment Scoring
Theme Clustering
Intelligence Built Into Every Result
Analysis, themes, narrative reporting and forecasting, generated from the study data you already collected.
Automated Analysis & Recommendations
AI-enabled analysis of study results, providing key findings and suggested next steps.
Theme Detection & Summaries
Automatically clusters open-ended responses into themes with plain-language summaries.
AI-Assisted Reporting
Generate a narrative report directly from study data, then refine it conversationally before export.
Prediction Models
Intelligent forecasting and predictive analytics that estimate future outcomes by using historical research data.
See these AI capabilities applied to your own study data.
Request a demo
Global Capabilities & Advanced Features
Ideal for global clients with multiple locations and analysts. Build a study in Zurich, translate it for a panel in São Paulo, and report on it in Singapore, all from the same platform. Work can be shared or kept separate across locations, and analysts can view the platform in their preferred language.
Request a demo
Migration assessment
Cross Organization Collaboration
Fully Secure
Enterprise-grade security with role-based access control, data isolation, and audit logging.
SSO
Authenticate using enterprise identity providers such as Microsoft Entra ID (Azure AD), Okta, and other SAML or OpenID Connect providers.
Respondent & UI languages
Deliver studies in multiple languages and tailored interface settings.
Templates manage workflows
Maintain a consistent setup across locations.
Security, Access & Integration
Multi-organization architecture
Each organization’s users, panels and data are stored separately.
Access Control List (ACL)
Manage application and study access with configurable Owner, Editor, and Viewer roles, supported by audit logs.
Enterprise standalone organizations
Give clients access through their own Administrator accounts.
Integrate other lab tools
LIMS connectivity for sample tracking and lab results, feeding directly into GPI studies.
Build Your Sensory Lab In GPI
Sensory Lab
A clean respondent interface, with display blinding and enforced product order, puts panelists at ease so they concentrate on testing.
Multiple Lab Testing
Set up a study centrally and collect data at different locations, with balanced product rotation, blinding codes, and Force Delay timers enforcing the protocol on-site.
Migration Support
And if you are moving from another system or bringing historical data with you, we support the whole transition, rebuilding your existing studies and templates, formatting and uploading your data, and connecting your LIMS and other sources, so your team moves across without ever missing a beat.
Request a demo
Migration assessment
Scales with your team and needs
From first test to global deployment, a plan for every stage.
Starter
For individuals and teams running targeted, ad hoc product experience research, a single claim test, a reformulation check, one market.
What you get:
Priced per project, no commitment
Classic sensory tests, templated for fast set-up and execution
Standard platform outputs and reporting
Single-language operation and testing
Technical support by email
AI features on all plans
Contact Sales
Growth
For innovation, insights and R&D teams whose investment decisions need repeatable, comparable evidence across projects, markets and time.
All the features in Starter Plus:
Annual subscription priced on usage; activate only the methods you need
Full multi-method study workflows; build and save your own projects and templates
Longitudinal tracking and cross-market comparison across your full project history
Multi-language operation and testing with live translation
Chat and email support from GPI's sensory and data science experts
24-hour global technical support
Scheduled online training programs, plus bespoke sessions on request
Structured onboarding and data migration from your old system
AI features on all plans
Contact Sales
Enterprise
For high-volume, cross-functional organizations running continuous product experience research across markets, panels, categories and lifecycle stages.
All the features in Growth Plus:
Enterprise agreement covering all teams and seats
Multi-team workspaces with study governance: approval workflows, protocol libraries, audit trail
Organization-wide data layer; benchmark across teams, categories and business units
Centralized management of multiple panels across markets
Sensory and data science experts, available on demand
Dedicated success manager, SLA-backed
SSO, custom branding, custom feature and algorithm development on request
AI features on all plans
Contact Sales